
If the baseball season happens, and that is still a big if, we are going to have to change our minds to think about baseball stats in 60 games, specifically the cumulative stats.
Without getting into advanced metrics, which are way better for comparing how a hitter is doing, how do we judge power on homer numbers? 20 home runs is good, 25 great, 30 is even better. But what does that mean for a 60 game season?
This is even more important for pitchers. 32 starts is a healthy season. 200+ innings means you hit your potential. How does this translate into a 60 game season?
One way to figure this out is to look at some Mets hitters and pitchers from 2019 and take their stats from 162 games and average it down to 60 games. This mimics a scale down of the amount of time they get to rest. For pitchers, it may over project, as I’m assuming many pitchers will be on a shorter pitch count at the start of the season and if that goes on for 3 starts, that’s 25% of the season.
Here are the stats!
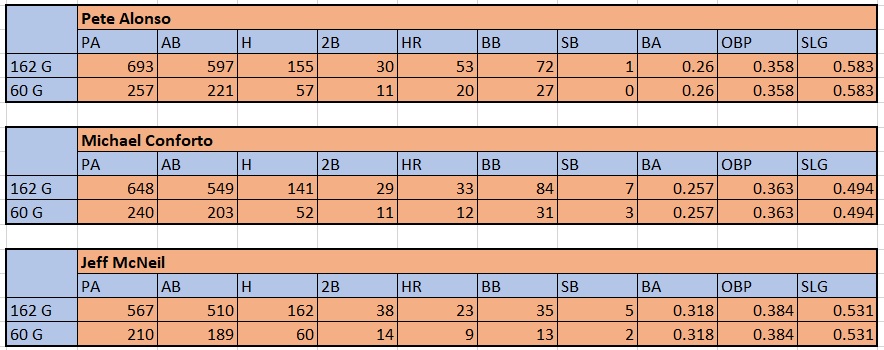
So Pete Alonso’s rookie setting 53 homer season would be reduced down to 20. Michael Conforto, a solid, All-Star caliber hitter, would hit around 12 bombs. Jeff McNeil, who just sprayed the ball all over the place last year would be down to 60 hits.
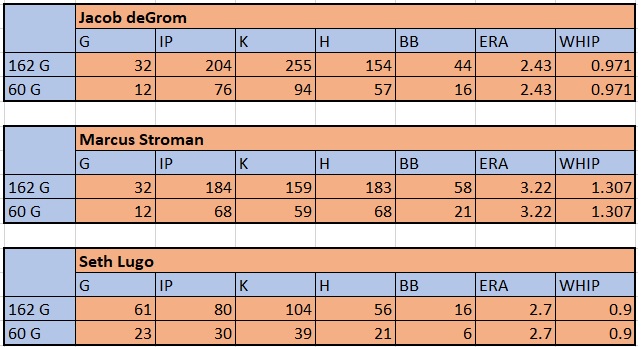
A pitcher making all their starts looks to go about 12 times. 70 innings for a starter would be hitting max efficiency (although that is probably overblown for a pitchers for the reasons outline above). deGrom led the league in strikeouts last year and that gets scaled down to 94, so its going to be a major accomplishment if someone breaks 100 (or they are starting more 12 times). A reliever like Lugo who saw a lot of action should expect to get into about 20 games.
This was helpful for me to envision what a 60 game season looks like and I hope it helps you too.


