Were They Right? Reviewing Travis d’Arnaud’s 2015 Projections

Travis d’Arnaud had a tough year with injuries which torpedoed his playing time. The playing time he did have was quite productive, especially for a catcher, let’s see how it compares to the projections the computers thought he would put up before the start of the 2015 season. Here are the original projections:

PECOTA (BP): 360 PA, 39 R, 18 2B, 1 3B, 12 HR, 46 RBI, .251 BA, .315 OBP
PECOTA (MLB.com): 504 AB, 63 R, 19 HR, 68 RBI, .252 BA, .318 OBP
MLB.com: 435 AB, 54 R, 15 HR, 58 RBI, .253 BA, .309 OBP
ZiPS: 399 PA, 50 R, 20 2B, 2 3B, 14 HR, 49 RBI, .255 BA, .313 OBP
Steamer: 497 PA, 52 R, 24 2B, 2 3B, 18 HR, 61 RBI, .252 BA, .311 OBP
ESPN: .255 BA, 57 R, 17 HR, 52 RBI

Average: 418.7 PA, 470 AB, 52.5 R, 20.6 2B, 1.7 3B, 15.8 HR, 55.7 RBI, .253 BA, .313 OBP

(Originally posted here)

And these are his 2015 numbers:
268 PA, 31 R, 14 2B, 1 3B, 12 HR, 41 RBI, .268 BA, .340 OBP

Travis crushed it. His numbers are extremely close to his projected numbers, and he played way, way less than the computers thought he would. The evidence is really in his OBP, its almost 30 points higher than projected, that combined with his homers, show that if he played the whole year, he could have had a really special year.

Posted in Main Page | Leave a comment

Were They Right? Reviewing Lucas Duda’s 2015 Projections?

Lucas Duda is a unsung hero of this team. At several points over the last calendar year there were calls for the Mets to trade or sign someone who is statistically similar to Lucas Duda. The Mets have a player in Duda who could potentially be a top 10 first basemen in the league, at least above league average. Let’s take a look at how the 2015 projection programs did with Lucas Duda:

PECOTA (BP): 532 PA, 63 R, 24 2B, 1 3B, 20 HR, 69 RBI, .242 BA, .335 OBP
PECOTA (MLB.com): 514 AB, 71 R, 22 HR, 78 RBI, .241 BA, .335 OBP
MLB.com: 525 AB, 68 R, 28 HR, 80 RBI, .248 BA, .339 OBP
ZiPS: 562 PA, 75 R, 26 2B, 1 3B, 26 HR, 92 RBI, .260 BA, .359 OBP
Steamer: 619 PA, 533 AB, 68 R, 25 2B, 1 3B, 24 HR, 75 RBI, .234 BA, .331 OBP
ESPN: .248 BA, 71 R, 27 HR, 76 RBI

Average: 571 PA, 524 BA, 69 R, 25 2B, 1 3B, 24.5 HR, 78 RBI, .246 BA, .340 OBP

(Originally posted here)

Here are his actual 2015 numbers:
554 PA, 67 R, 33 2B, 27 HR, 73 RBI, .244 BA, .352 OBP

Lucas Duda played almost the exact amount that the computers thought he would, so this makes this easier. Although he hit two points lower on batting average, he did better on on-base percentage. The only category the computers predicted higher than his actual production was his runs. His power and walks is the story here. He hit way more doubles than thought and his homer numbers were better too. The higher OBP suggests he did better at the plate looking for pitches.

The problem with Lucas is we are all so tuned into his streaks. We really know about all of his negative streaks, and don’t give a lot of thought to his positive streaks.

Posted in Main Page | Leave a comment

Were They Right? Reviewing Wilmer Flores’s 2015 Projections

There was a world of demands for Flores before the start of the 2015 season. The hope was the Mets would go out and via a trade or free agent signing get a marquee shortstop, but the Mets went in with Flores. We don’t really need to go into the details of what happened to Flores this season (they are documented everywhere). In 2016, the Mets have multiple players who can play shortstop, so the amount of playing time for Flores seems unclear, but were the projections right about 2015? Here’s what they thought:

PECOTA (BP): 314 PA, 30 R, 16 2B, 1 3B, 9 HR, 37 RBI, .255 BA, .288 OBP
PECOTA (MLB.com): 479 AB, 51 R, 14 HR, 58 RBI, .255 BA, .288 OBP
MLB.com: 450 AB, 54 R, 12 HR, 50 RBI, .262 BA, .304 OBP
ZiPS: 570 PA, 73 R, 24 2B, 4 3B, 17 HR, 80 RBI, .266 BA, .300 OBP
Steamer: 510 PA, 476 AB, 48 R, 22 2B, 2 3B, 15 HR, 57 RBI, .248 BA, .286 OBP
ESPN: .264 BA, 35 R, 8 HR, 32 RBI

Average: 465 PA, 468 AB, 48.5 R, 20.7 2B, 2.3 3B, 12.5 HR, 60.7 RBI, .258 BA, .293 OBP

(Originally posted here)

And here are his actual 2015 numbers:
510 PA, 55 R, 22 3B, 16 HR, 59 RBI, .263 BA, .295 OBP

Flores played a bit more than it was thought he would play (when looking at the data before averaging, you can see that the different providers were all over the place in terms of how much he would actually play). He did well, he actually for the most part beat the projections. He slammed 16 homers (I remember laughing last year at ZiPs when they thought he would hit 17 over 570 PAs which is really close to what he did), had a lot more doubles than projected and hit 5 points better and had pretty much the expected on base percentage. He put up really solid numbers.

His problem of course was defense, which is ultimately why his playing time will be cut to about 30-50% of what he had last year, but that’s ok. If he can put up similar numbers that are prorated for his playing time, that would still be a huge boost to this team.

Posted in Main Page | Leave a comment

Mets Baseball Card of the Day: 2015 Bowman Chrome Autograph – Akeel Morris

A rookie last year with his prospect autograph Bowman Chrome card coming out in the same year! Here’s Akeel:

akeelmorris

Posted in Main Page | Leave a comment

Were They Right? Reviewing Curtis Granderson’s 2015 Projections

Curtis Granderson often gets over shadowed for his performance in 2015. He easily had his best season as a Met and had one of the best on the Mets. The Mets success in 2016 is relying on Granderson to put up similar numbers to his 2015 campaign. But were computers able to predict his success in 2015? Here is what the computers thought he would do:

PECOTA (BP): 538 PA, 74 R, 18 2B, 4 3B, 21 HR, 63 RBI, .227 BA, .315 OBP
PECOTA (MLB.com): 515 AB, 73 R, 24 HR, 77 RBI, .227 BA, .316 OBP
MLB.com: 511 AB, 72 R, 22 HR, 66 RBI, .237 BA, .322 OBP
ZiPS: 521 PA, 71 R,  19 2B, 3 2B, 21 HR, 60 RBI, .231 BA, .319 OBP
Steamer: 535 PA, 465 BA, 60 R, 20 2B, 2 3B, 19 HR, 56 RBI, .222 BA, .313 OBP
ESPN: .231 BA, 77 R, 23 HR, 65 RBI

Average: 531 PA, 497 AB, 71 R, 19 2B, 3 3B, 22 HR, 64.5 RBI, .229 BA, .317 OBP

(Originally posted here)

And here are is his actual 2015 numbers:
682 PA, 98 R, 33 2B, 2 3B, 26 HR, 70 RBI, 11 SB, .259 BA, .364 OBP

Granderson played way more than the computers thought that he would. On homers, it looks like the computer thought he would have more power (22 homers in 530 PA vs the actual 26 over 682). Curtis ended up hitting 30 points better and his OBP was much higher as well. Curtis Grandrson had a great season, and none of the projection sites, books, magazines, etc never saw Curtis doing these things. Just as a quick preview, most of the 2016 projections have Curtis returning similar hitting numbers from before 2015.

Posted in Main Page | Leave a comment

Mets Baseball Card of the Day: Topps 2012 Josh Thole

Ready for a blast from the recent past? Here’s Thole!

joshthole

Posted in Main Page | Leave a comment

Were They Right? Reviewing Juan Lagares’s 2015 Projections

Juan Lagares entered 2015 in an interesting spot. He was easily the best defender in the outfield the Mets have and at the start of the season he had a starting job flanked by Cuddyer and Granderson. Mayberry would be interjected with Cuddyer and Lagares from time to time. The Mets had Conforto about to come up and the outfield was going to get crowded. Unforeseen when the projections were made last year, the Mets would acquire Cespedes. Now Lagares is the 4th outfielder with de Aza.

Here’s what the projections thought Lagares would do in 2015:

PECOTA (BP): 433 PA, 46 R, 20 2B, 3 3B, 4 HR, 33 RBI, 10 SB, .253 BA, .292 OBP
PECOTA (MLB.com): 548 AB, 62 R, 6 HR, 45 RBI, 13 SB, .252 BA, .292 OBP
MLB.com: 520 AB, 70 R, 6 HR, 54 RBI, 2o SB, .271 BA, .311 OBP
ZiPS: 542 PA, 58 R, 25 2B, 5 3B, 6 HR, 55 RBI, 13 SB, .264 BA, .305 OBP
Steamer: 584 PA, 534 AB, 52 R, 27 2B, 3 3B, 8 HR, 49 RBI, 12 SB, .249 BA, .290 OBP
ESPN: .259 BA, 60 R, 6 HR, 51 RBI, 17 SB

Average: 519 PA, 534 AB, 58 R, 24 2B, 3.6 3B, 6 HR, 47.8 RBI, 14 SB, .258 BA, .298

(Originally posted here)

And his actual 2015 numbers:
465 PA, 47 R, 16 2B, 5 3B, 6 HR, 41 RBI, 7 SB, .259 BA, .289 OBP

Were they right? More or less. Lagares had considerably less time than projected, thanks to Cespdes. His runs, doubles and stolen bases still would have been below projected if he played out 519 PA. His OBP was down nearly 10 points but his batting average was nearly projected perfectly. His triples and homers interestingly would have ended high above projections if he played out 519 PA, his RBI total would have been just about right. There seems to be a balance here of over projected and under projected, so in the end, he sort of played to his to projections.

The 2016 projections are going to be way more difficult as it is really unclear how much playing time he will get this season.

Posted in Main Page | Leave a comment

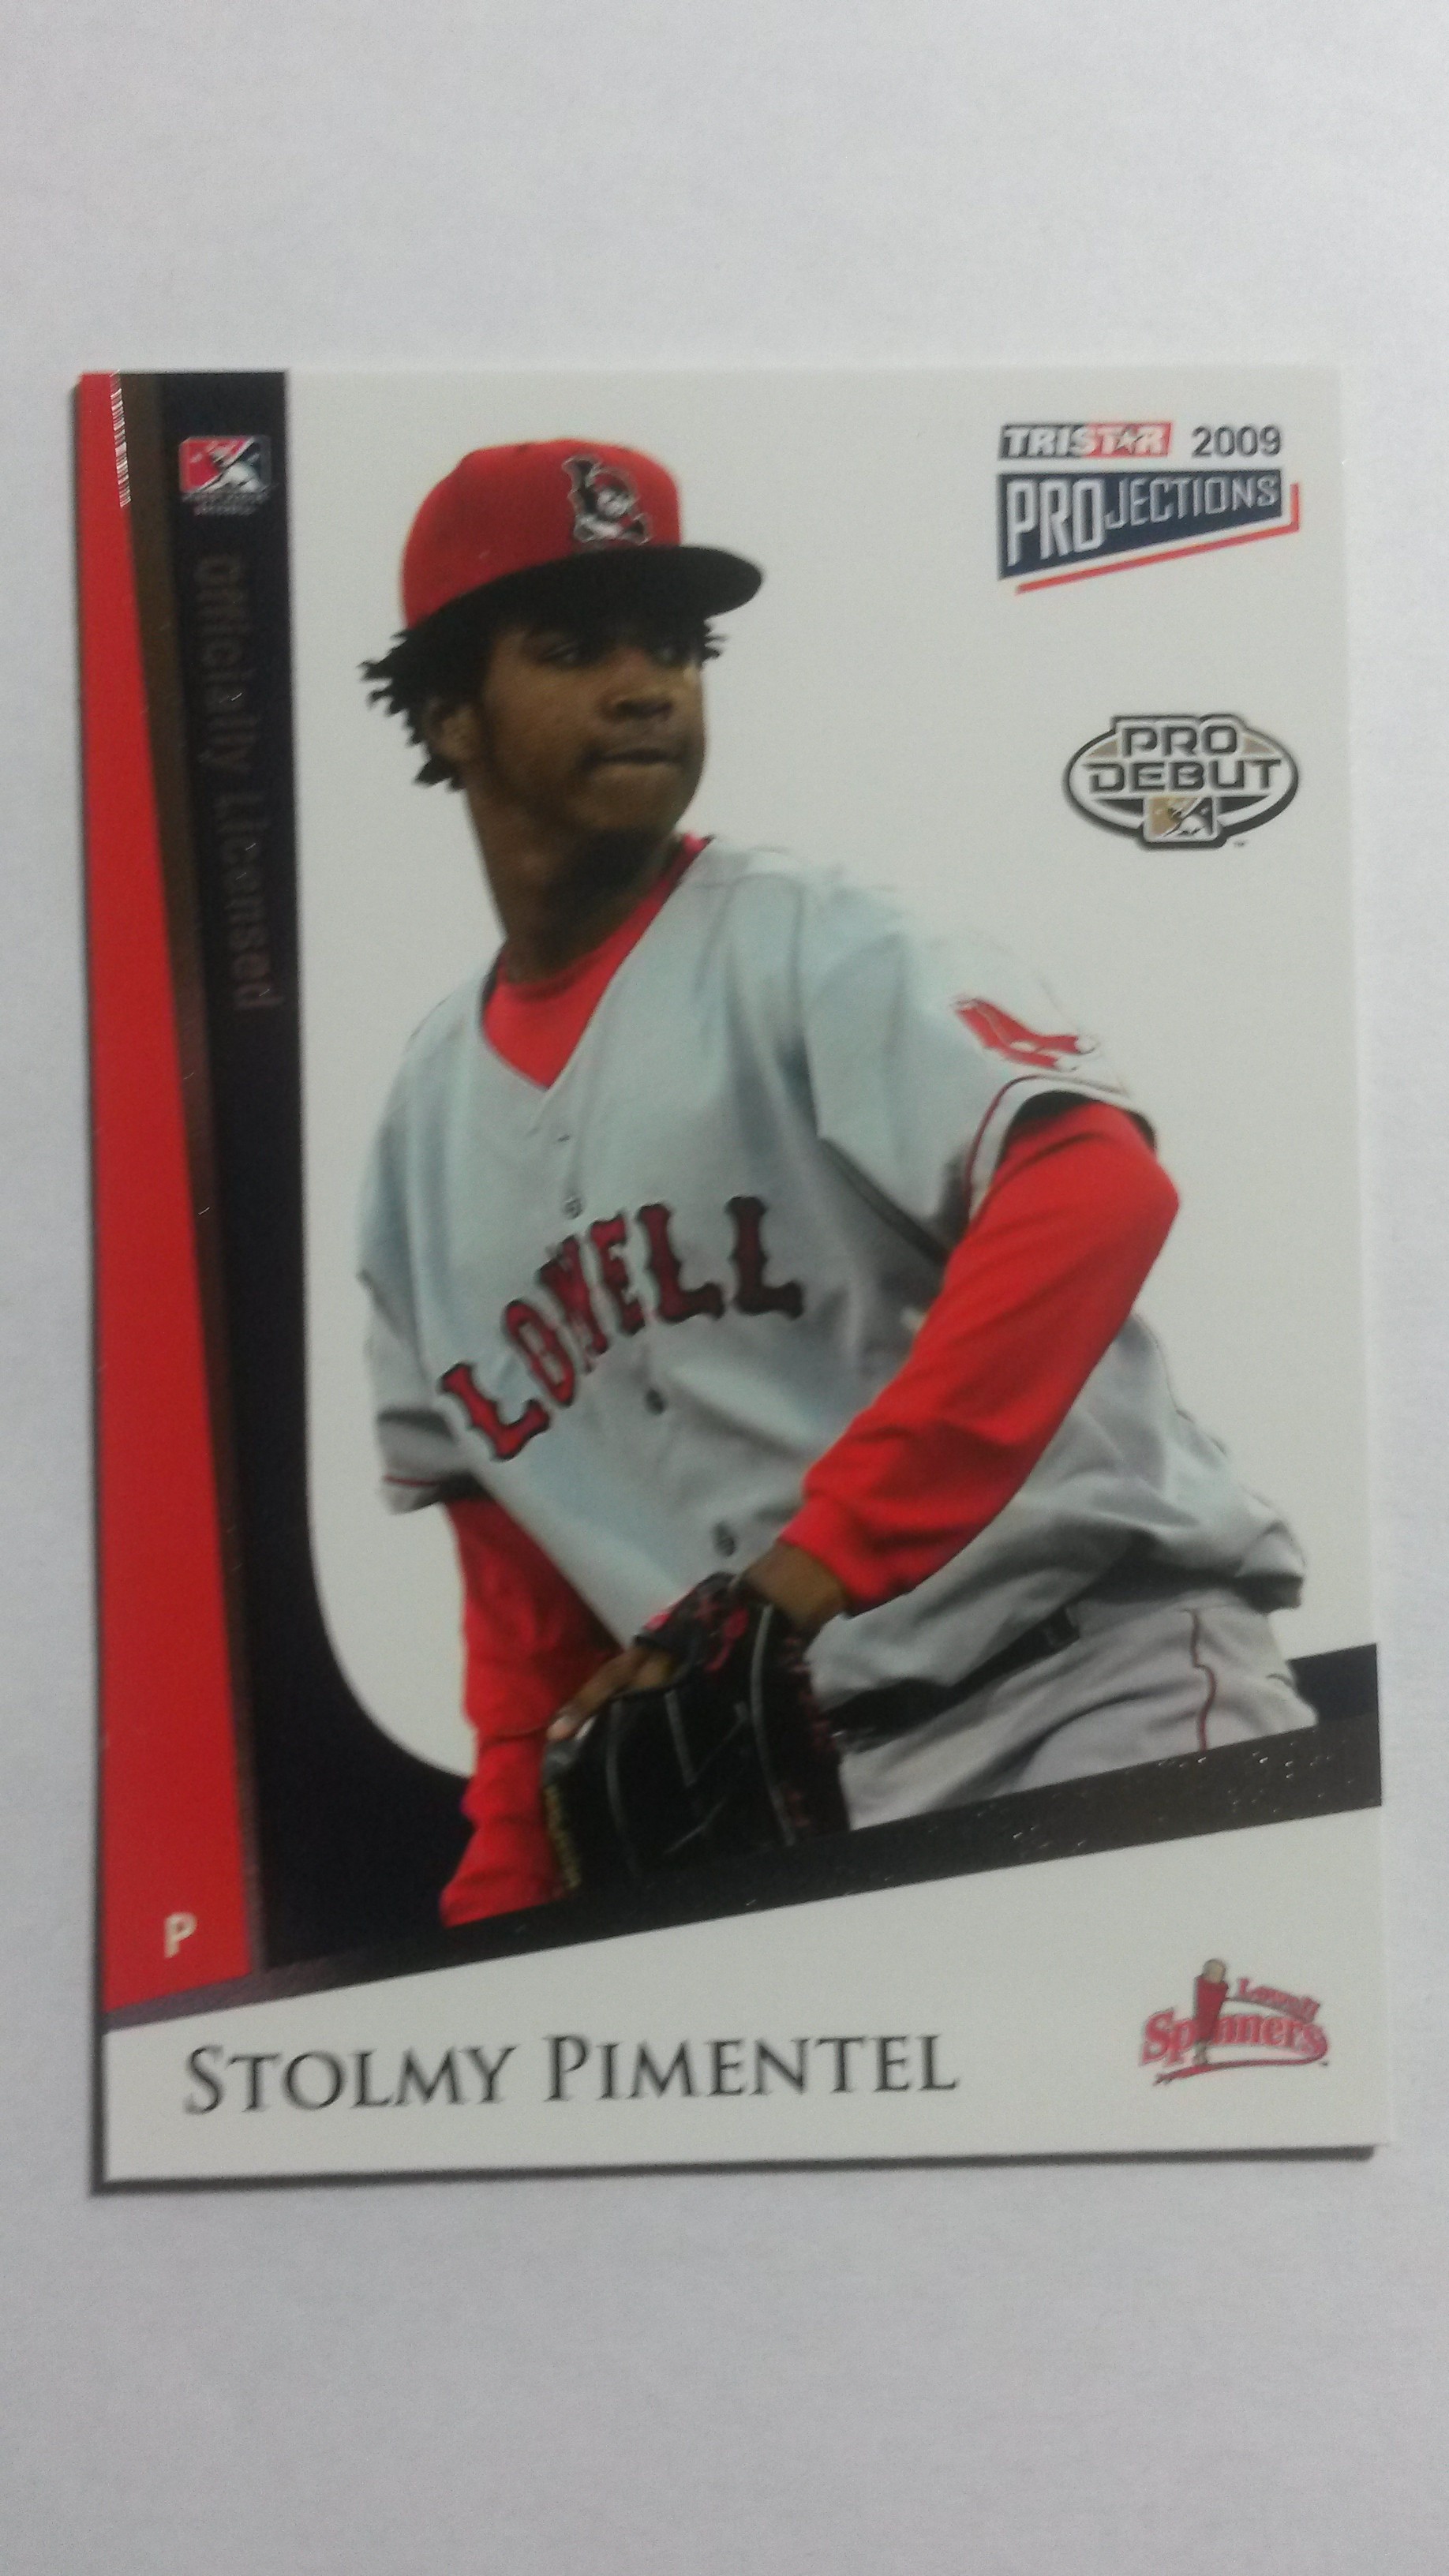
Mets Baseball Card of the Day: 2009 Tristar Projections Stolmy Pimentel

Here’s one of the first cards (with the “Pro Debut” stamp!) for one of the newest Mets in spring this year, Stolmy Pimentel:

stolmy

Posted in Main Page | Leave a comment

Were They Right? Reviewing John Mayberry Jr.’s 2015 Projections

Underrated aspect of the 2016 Mets season? John Mayberry Jr doesn’t factor as a major piece. Mayberry was a major off season signing for the Mets before the start of 2015. He originally was going to play the role of a hitting specialist, getting starts against LHP, pinch hits and starting in the outfield whenever someone starts to slip (Lagares? Cuddyer?). He ended up being terrible for the Mets. There was some concern that he would be a repeat of Chris Young once the Mets let John go, but that didn’t hold true at all. There was an additional concern that this year’s signing of de Aza would be like Mayberry, but then Cespedes.

Did the computers accurately predict the Mayberry mess? Let’s take a look!

PECOTA (BP): 250 PA, 27 R, 12 2B, 7 HR, 27 RBI, .232 BA, .293 OBP
PECOTA (MLB.com): 201 AB, 23 R, 7 HR, 26 RBI, .229 BA, .290 OBP
MLB.com: 133 AB, 11 R, 4 HR, 12 RBI, .226 BA, .295 OBP
ZiPS: 333 PA, 302 AB, 38 R, 17 2B, 10 HR, 40 RBI, .228 BA, .294 OBP
Steamer: 217 PA, 196 AB, 20 R, 28 2B, 9 HR, 22 RBI, .224 BA, .289 OBP
ESPN: .227 BA, 14 R, 4 HR, 13 RBI

Average: 267 PA, 208 AB, 22 R, 19 2B, 6.8 HR, 23 RBI, .227 BA, .292 OBP

(Originally posted here).

His actual 2015 numbers:
119 PA, 110 AB, 8 R, 6 2B, 3 HR, 9 RBI, .164 BA, .227 OBP

Mayberry ended up playing about half the amount than the computers thought he would. His homerun numbers are the only thing that are really close when adjusted for that. His hitting numbers were way down. None of the computers thought he was going to have a real strong season, but they didn’t expect him to struggle as much as he did.

Posted in Main Page | Leave a comment

Mets Baseball Card of the Day: Topps 2015 Sean Gilmartin

Sean Gilmartin was a rule V draft pick who made his major league debut with the Mets last year, which led to his rookie card being released in the Topps 2015 Updates and Highlights series:

seangil

Posted in Main Page | Leave a comment